Instagram analytics: the complete guide for brands and creators

Instagram analytics are the metrics that show how your content performs, reach, engagement, saves, follower change, and what to do about it.
Read well, they tell you which posts earn attention, which audiences are actually paying attention, and where your next gain is hiding. Read badly, they’re a screen of numbers nobody acts on.
Most brands and creators don’t have a data problem on Instagram. They have an interpretation problem: plenty of metrics, not enough meaning. This guide covers what Instagram analytics are, why they matter, how to check them, the metrics worth tracking, and how to turn the numbers into a strategy that compounds.
The short version:
- Instagram analytics measure reach, engagement, audience and content performance over time.
- The native Professional dashboard and per-post Insights cover the essentials; third-party tools add depth and reporting.
- Engagement rate is the number that matters most. Instagram averages well below 1%, so 1–5% is a strong target.
- Reach is the easy metric. Saves, shares, comments and follower change are the ones that predict growth.
What are Instagram analytics?
Instagram analytics are the metrics you use to understand how your content performs, from a snapshot of one post’s reach and engagement rate to a view of how everything you publish trends over time.
Those metrics are the raw material for a content strategy that works. Knowing what time of day your audience is most active, or which Instagram ads pull their weight, lets you be deliberate about what you post, when you post it, and why. The point isn’t the data. It’s the decisions the data makes possible.
For context on scale: since launching in 2010, Instagram has grown past 2 billion monthly active users, roughly a quarter of the planet’s internet population. Being on the platform and using it well are two different things, and the gap between them is mostly a question of how you read the Instagram algorithm and act on what your analytics tell you.
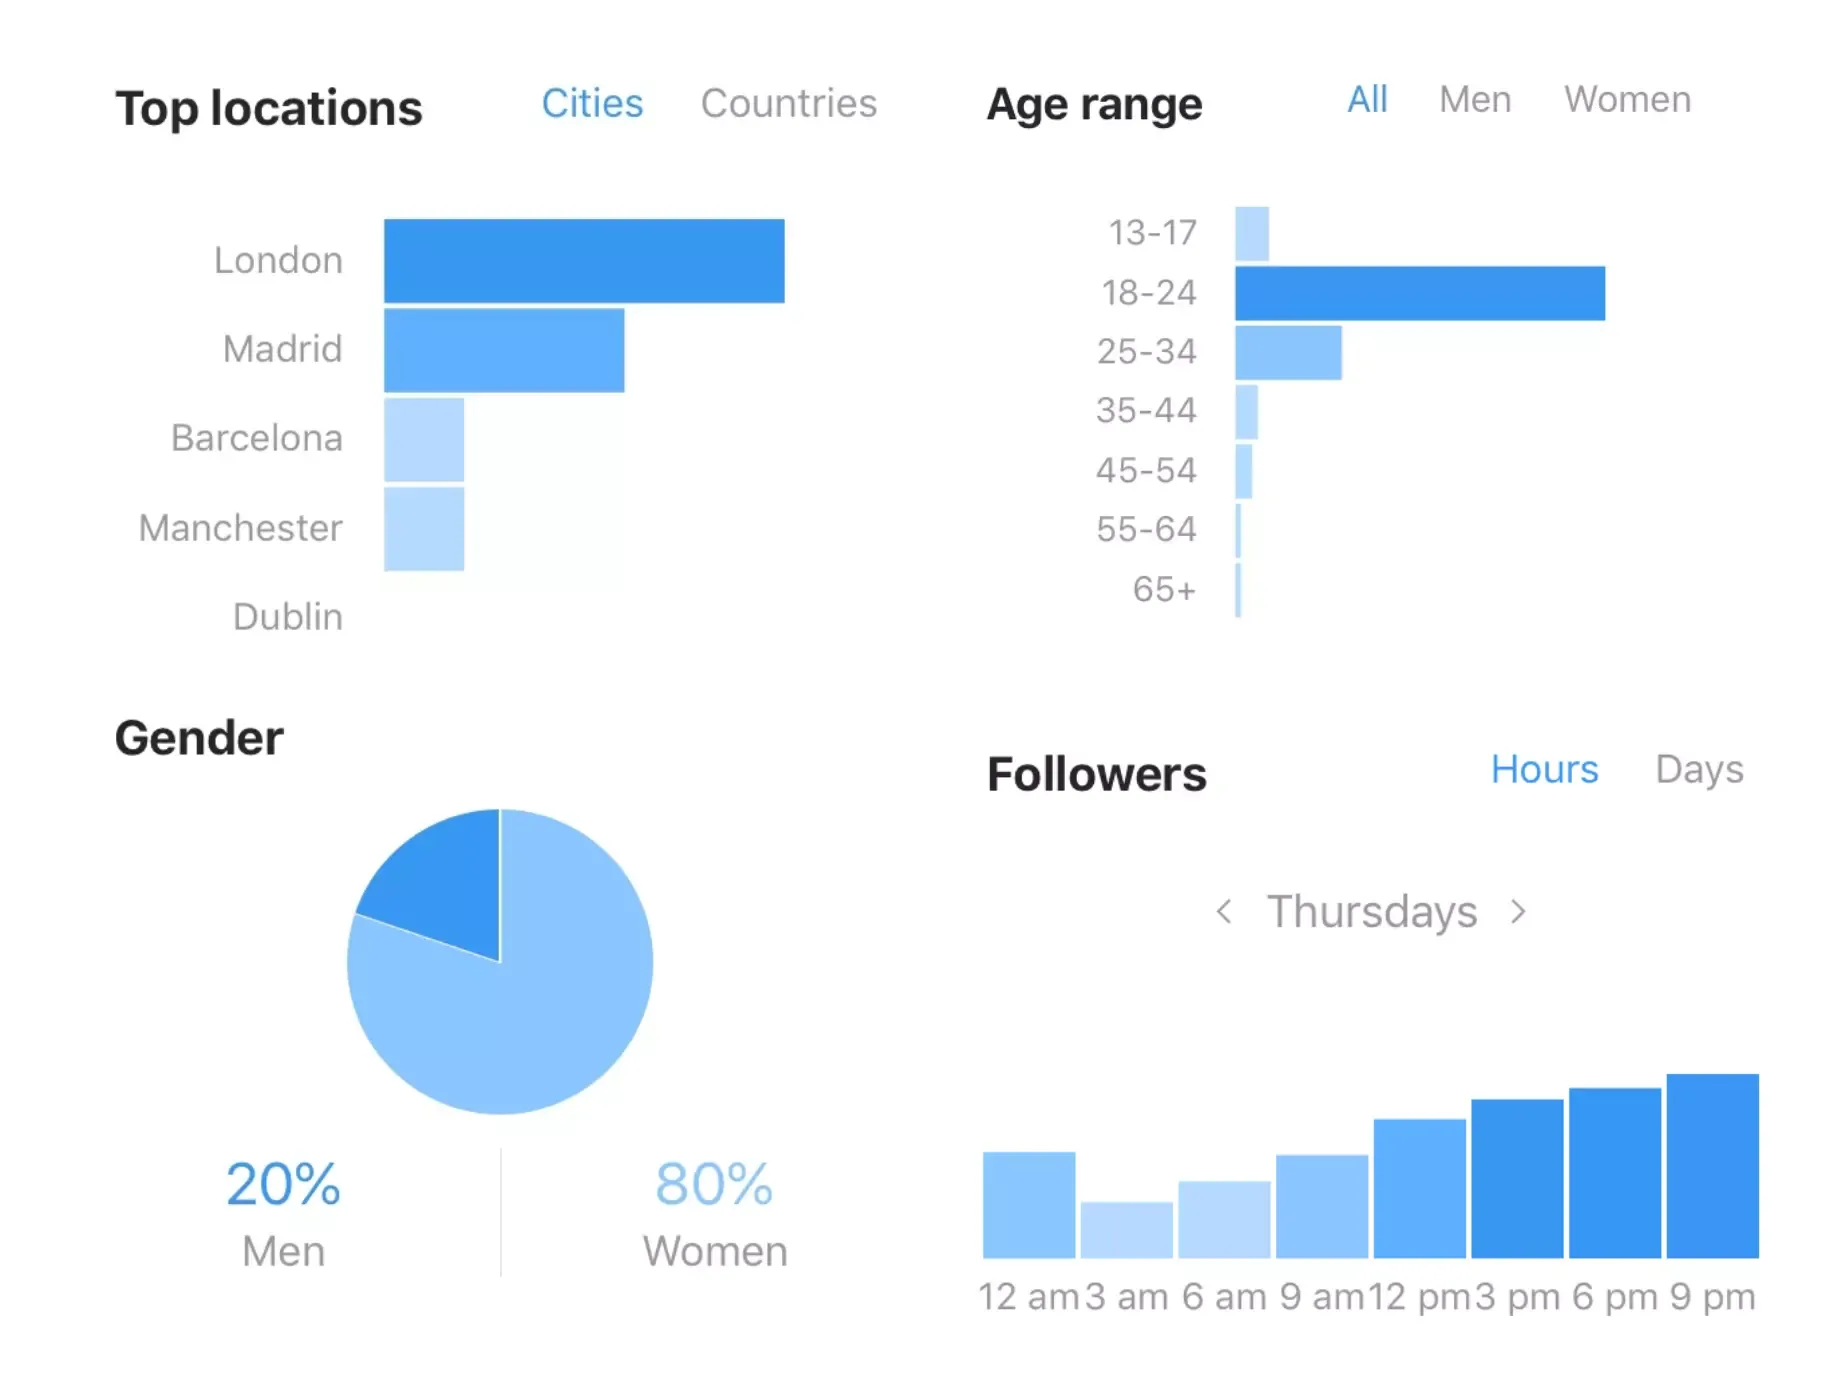
Credit: Search Engine Journal
Why are Instagram analytics important?
Without performance data, you’re guessing. You don’t know whether a post will land before you publish it, and you don’t know what to prioritise next.
If Instagram is a growth channel for you, that guesswork is expensive. Analytics give you the under-the-hood view of what’s working and what isn’t, and the confidence that the content in your pipeline will deliver, rather than the hope that it might. The brands and creators who grow fastest aren’t the ones posting most. They’re the ones reading the signal and adjusting.
How to check Instagram analytics
You can check Instagram analytics directly in the mobile app on a professional (business or creator) account:
- On your profile, tap the Professional dashboard link below your bio.
- From there you can see accounts reached, accounts engaged, total followers and the content you’ve shared.
To see a single post’s numbers, open the post and tap View insights. You’ll get likes, comments, shares, saves, reach and the follower vs. non-follower split.
Native Insights aren’t available on desktop, though you can still review per-post stats from a computer. The native view is excellent for a single account; what it won’t do is show you how influence performs across a roster of creators, formats and campaigns over time. That cross-account picture is where most brands lose the plot, and where a strategic partner earns its keep.
Instagram analytics for business
Brands track different things from individual users. Where a consumer scrolls to connect with friends, a business reads metrics to expand reach and grow a relevant following. That means knowing what good and poor performance actually look like on the platform.
Benchmarks help. While the average engagement rate on TikTok has run around 2.5–4% in recent years, Instagram typically sits below 1%. A rate of 1–5% is a healthy target on Instagram. Used as a benchmark against your own content, that number tells you whether you’re outperforming the platform or coasting on it.
How to build an Instagram analytics report
Once you know what to expect from each metric, turn it into a report. You can pull data manually from the app and collate it externally, or let a social media analytics tool do the gathering for you.
The harder part is the cross-channel view. If your growth runs partly through creator partnerships, the metrics that matter are spread across every collaborator’s account, not just your own. Joining those signals into one picture of how your influence performs over time is the difference between a report and a strategy.
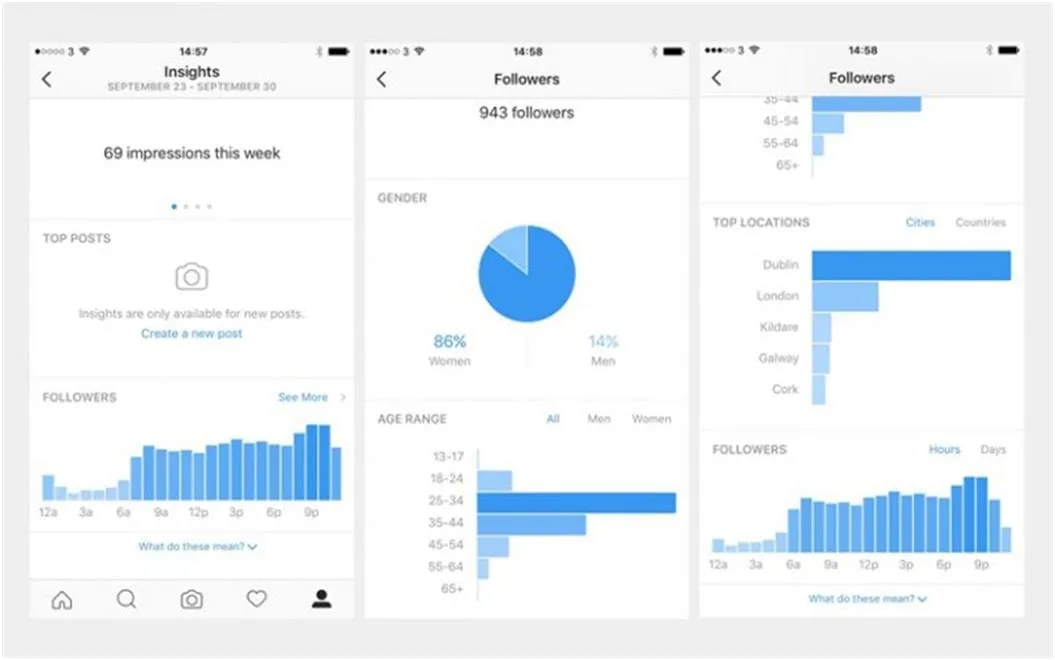
Credit: Rising Women Network
What are the best Instagram metrics to track?
What you track depends on what you’re trying to achieve. But a handful of metrics are non-negotiable if you want to know whether your Instagram marketing strategy is working.
Instagram follower analytics
Insights show changes in your follower count, so you can tie a given week’s activity to a gain or a dip. Per-post data also splits reach by follower vs. non-follower, and reaching non-followers is how you grow your audience.
The levers: consistently engaging content, sharp Instagram captions, well-chosen hashtags, boosted posts, and partnerships with creators whose audiences already overlap with yours.
Instagram engagement analytics
Engagement metrics count the likes, shares, comments and saves a post earns over a period. You can calculate the rate a few ways, depending on what you want to measure:
- Engagement rate by reach (ERR): divide a post’s total engagements by its reach, then multiply by 100. If 200 people saw a post and five engaged, that’s 5 / 200 × 100 = 2.5%.
- Daily engagement rate: divide your total engagements in a day by your follower count, then multiply by 100. Twenty engagements against 1,000 followers is 2%.
Engagement is the metric that matters most, because it shows people investing something of their own: attention, opinion, a tap. Reach only tells you a post was seen.
Instagram post analytics
Per-post analytics break down each post’s performance: likes, comments, shares and saves, plus accounts reached, the follower vs. non-follower split, and total accounts engaged. Saves and shares are worth extra weight. They signal content people want to keep or pass on, which the algorithm reads as quality.
Instagram Story analytics
Stories have two metrics worth watching:
- Engagement rate (by followers or reach): how many people interacted with a Story.
- Completion rate: how many watched it all the way through, a clean read on whether the content actually holds attention.
Instagram hashtag analytics
If you’re selling products, hashtags can reach the right audience even without a large following, because people who follow a hashtag have already declared they care about the topic.
Check hashtag performance in per-post Insights: under reach and impressions, you can see how many people found the post through a hashtag. A dedicated social media management platform gives you a fuller view of how your hashtags perform across posts. (Worth noting: hashtags carry less discovery weight than they once did. Treat them as a supporting signal, not a growth strategy on their own.)
What Instagram analytics tools should you use?
There are plenty of Instagram analytics tools, and the right one depends on your goals and the questions you need answered. Native Insights covers a single account well. Third-party tools add scheduling, benchmarking, competitor tracking and shareable reports.
Where they all stop short is the cross-creator picture: measuring how a roster of partners performs as one system, not a stack of separate accounts. Native tools were built to report on one account; influence at brand scale runs across many.
How we see it
Native analytics tell you what each post did. They won’t tell you which creators to back, how influence compounds across a brand over time, or how to turn a strong engagement rate into sustained, measurable growth.
That’s the work we do. Vamp is a tech-enabled influencer marketing agency: we design creator-led growth systems and build the measurement behind them, so attention on Instagram becomes growth you can actually count, not another report nobody reads.
FAQs
What is a good engagement rate on Instagram?
On Instagram, 1–5% is a healthy range. The platform average sits below 1%, so anything above that is outperforming the field. Judge your rate against your own history and your category, not a single universal number.
How do I check Instagram analytics?
On a professional account, tap the Professional dashboard below your bio for account-level metrics, or open any post and tap “View insights” for per-post data. Native Insights are mobile-only; third-party tools add desktop reporting and historical trends.
Which Instagram metrics matter most?
Engagement (saves, shares, comments), follower change tied to specific activity, and reach split by follower vs. non-follower. These predict growth far better than impressions alone.
Can I see Instagram analytics on desktop?
Native Instagram Insights are only available in the mobile app. To analyse performance on desktop, or across multiple accounts and creators, you’ll need a third-party tool or a partner that consolidates the data for you.
Turn the numbers into a strategy that compounds
Keeping tabs on your Instagram performance is table stakes. Turning that data into sustained relevance, knowing which signals to act on, which creators to back, and how influence builds across a brand over time, is the harder, more valuable problem.
That’s the one we solve. Vamp builds creator-led growth systems for brands that want influence to perform on Instagram, not just appear. Talk to us.