
Here, we cover everything you need to know about Instagram analytics and how to make the most of the platform to grow your business
Since its launch in 2010, Instagram has amassed over 1.35 billion users. This number is expected to grow to 1.44 billion in 2025, giving brands access to over one third of the global internet population. It’s definitely the party you don’t want to miss.
That said, being on Instagram and leveraging the platform successfully are two very different things. The Instagram algorithm has evolved dramatically since its inception. The way content is curated and shown to users depends on how strategic you are in your approach.
Instagram analytics is a powerful tool that gives you insights into how others engage with your content and how successful each piece of content is in helping you to achieve your goals. Understanding Instagram analytics and which specific metrics to track will help you develop an effective Instagram marketing strategy.
Read on to find out what Instagram analytics are and how you can make the most of them to boost sales and brand visibility.
Instagram analytics are the metrics you use to understand the performance of your content. They include everything from a snapshot look into the reach and engagement rate of a specific post, to an overview of how your overall content is performing over time.
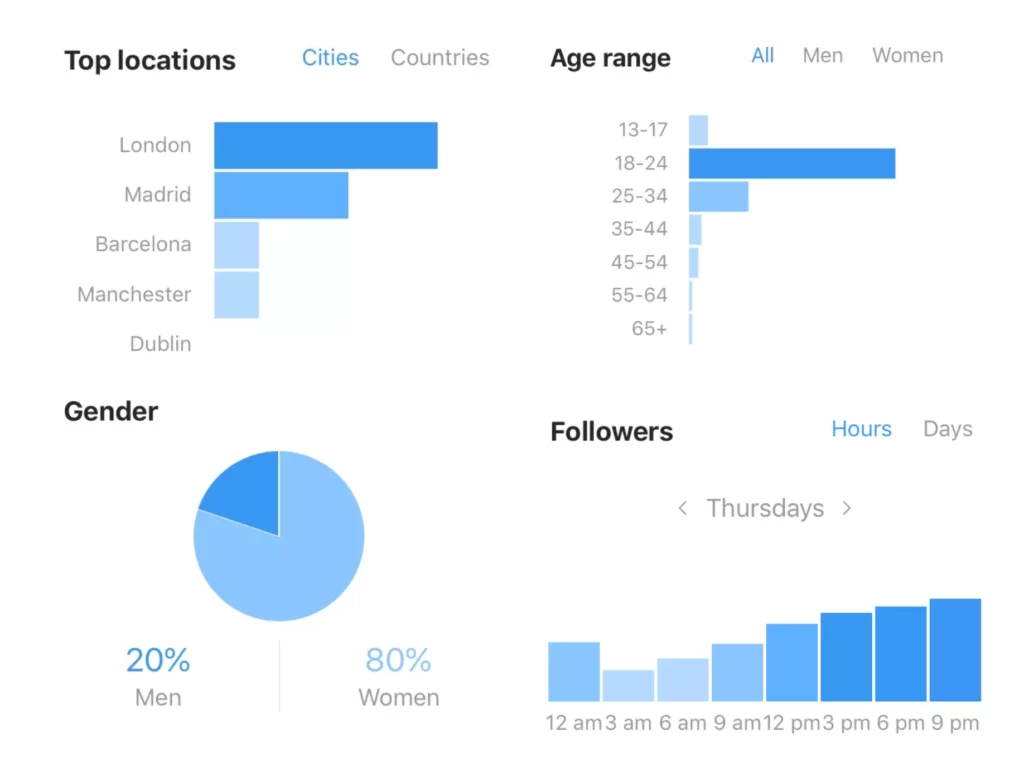
These insights are invaluable for building an effective content strategy. Looking at specific metrics around what time of day your audience is most active or which Instagram ads perform the best will help you be more intentional around what, when, and how you post.
Unless you track the performance of your content, you’re playing Russian roulette with your social media efforts. You’ll have little idea whether a piece of content will perform well or not. And you won’t know what kind of content you should prioritize in the future.
If you’re using Instagram as a growth tool, then you need to be strategic with your content plan. Instagram analytics can give you that ‘under-the-hood’ view into what’s working and what isn’t, and it can give you the confidence that the content in your pipeline will deliver the outcomes you’re looking for.
You can check Instagram analytics on the Instagram mobile app.
You can also click on individual posts and then go to Insights to check the performance of that particular post.
Instagram Insights isn’t available on desktop; however, you can still use your computer to check stats for your individual posts.
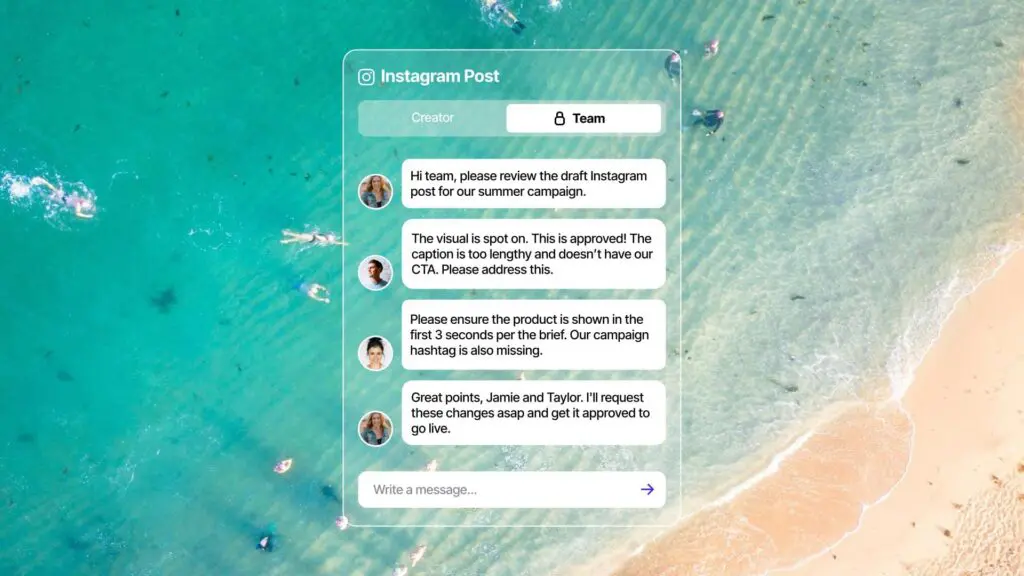
If social media features heavily in your marketing strategy, then it’s worth investing in a platform like Vamp, which can give you a more holistic overview of how your content performs over time. For instance, Vamp requires all influencers on the platform to have an Instagram business or creator account so that clients can see key metrics such as engagement rate, impressions, and unique reach.
Unlike individual consumers, who may use the platform to connect with family and friends, businesses rely on specific metrics to expand their reach and grow their followers. In this context, you need to know what good and poor performance looks like for each platform.
For instance, while the average engagement rate for TikTok in 2022 was 4.25%, Instagram averaged around 0.6%. In general, an engagement rate of 1-5% is a good number to strive for. Being aware of these metrics and using them as a benchmark against the performance of your own content can help you understand whether you’re doing well or if you need to up your efforts.
Once you know what to expect from each type of metric, it’s time to build your Instagram analytics report. You can either do this manually by pulling out data directly from the app and collating that data in an external report, or you can use a social media analytics tool to do it for you.
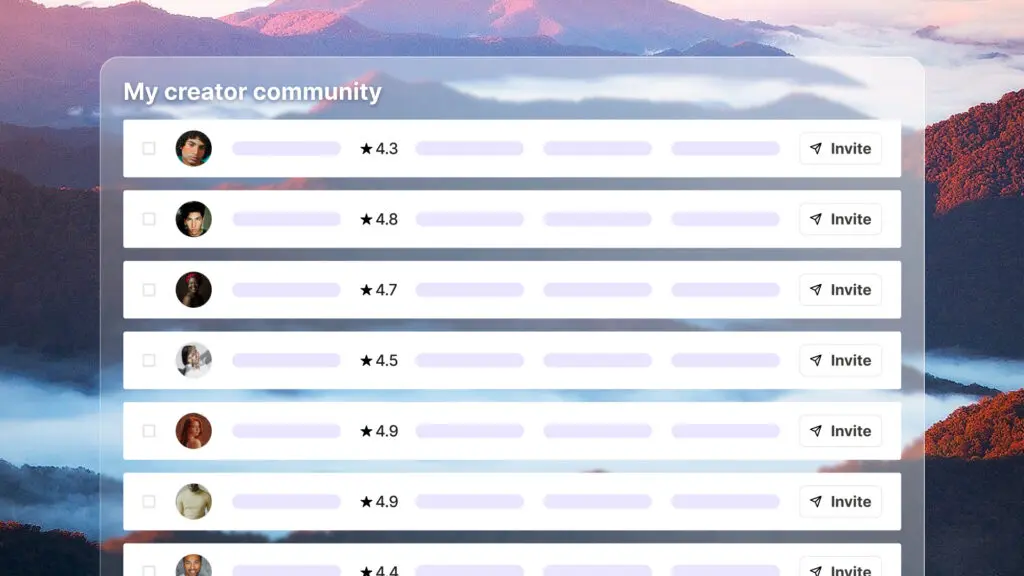
Do you market your brand through influencer collaborations? Vamp provides a detailed overview of how your campaigns perform over time. This gives you a bird’s eye view of your activities, and helps you spot any trends so you can refine your strategy.

What analytics you decide to track will depend on what you’re looking to achieve on the platform. Still, there are some must-have metrics you need to keep tabs on if you want to know whether your Instagram marketing strategy is working.
These are:
Instagram Insights can show you any changes in your followers so you can link your activity level in any given week to a change in follower numbers. Individual post insights also show you data on your reach and how many of those people are followers vs. non-followers. Of, course you want to get your content in front of as many non-followers as possible to grow your audience.
A good way to do that is to post engaging content. Other approaches you can use include on-point Instagram captions, popular Instagram hashtags, boosting your posts, or partnering with influencers.
Engagement metrics look at the amount of likes, shares, and comments your posts have received in a given period. You can calculate your rate in different ways, depending on whether you want to look at individual posts, your reach, or your followers.
Engagement rate by reach (ERR): To work out your ERR, look at the engagement of a post (likes, shares, comments etc), divide this by the reach of the post, and then multiply this number by 100 to get a percentage.
For instance, say 200 people have seen your post and five have engaged with it in some way. Your ERR would be 5/200 x 100 = 2.5%.
Daily engagement rate: Take your total engagements in a day and divide them by your total number of followers. Multiply this by 100 to get a percentage.
For example, you may have 20 engagements in a day and 1,000 followers. In this case, your engagement rate would be 2%.
Instagram post analytics give you a detailed breakdown of the performance of each post. Whether you access Instagram via desktop or your mobile you can see data such as likes, comments, shares, and the number of saves. You can also see the number of accounts your post has reached, how many of these are followers vs. non-followers, and how many accounts have engaged with your post in total.
Instagram Stories have two main metrics:
If you’re selling products, hashtags are a great way to reach a wide audience even if you don’t have many followers. It’s also a great way to make sure you reach the right audience as the people who follow the hashtags have already told the platform that they care about that specific topic.
You can check the performance of your hashtags by looking at Insights for your individual posts. Under Impressions, you can see how many people have found you through one of the hashtags you’ve used.
If you’re using a dedicated social media management platform, you’ll have a more detailed understanding of the overall performance of your hashtags.
The good news is that there are plenty of Instagram analytics tools to choose from. Which one you go for will depend on your specific needs and budget.
If you’re interested in influencer marketing, then Vamp could save you considerable time and money. We help businesses build, manage, and analyse all their social media influencer campaigns. You can easily find the right influencer for your industry and see, at a glance, how various campaigns perform over time.
Social media is one of the most powerful tools marketers have at their disposal to reach and grow their audience. Instagram, with its focus on visual aesthetics, is an effective marketing channel that most brands can’t afford to miss out on.
Still, Instagram can often feel crowded with so many brands vying for people’s attention. Keeping tabs on your performance will help you be more intentional with how you engage your audience and how you present your brand.
Ready to get started? Get in touch with our friendly team and we’ll be happy to show you how to make Instagram your marketing best friend.