The social media metrics that actually matter, by funnel stage

Social media metrics are the measures that tell you whether your content is working, and the ones worth tracking map to the stage of the funnel you're trying to move.
The metrics that matter are the ones tied to a goal. Awareness goals need reach, impressions and share of voice. Engagement goals need engagement rate and saves. Conversion goals need click-through and conversion rate. Revenue goals need cost per acquisition and revenue generated. Pick the few that map to what you’re trying to achieve, and ignore the rest.
Most brands don’t track too little. They track too much, a wall of numbers nobody reads, with no line back to a decision. This guide covers the social media metrics that matter, organised by funnel stage, plus the tools to measure them and how to turn the data into action.
The short version:
- Social media metrics fall into five groups: awareness, engagement, conversion, ROI and customer care.
- Match the metric to the goal. A metric that doesn’t change a decision is a vanity metric.
- Reach and impressions measure exposure. Engagement, conversion and revenue measure impact.
- Track over time, not in snapshots. Trends tell you more than any single number.
What are social media metrics?
Social media metrics are the data points that measure how your content and channels perform, from how many people saw a post to how many bought because of it. Read together, they show you what your audience responds to, where attention is moving, and which of your investments are actually driving growth.
The value isn’t in the measuring; it’s in the decisions the measurement makes possible. Track your social media metrics regularly and you can prove ROI, find what to fix, and make calls based on evidence rather than instinct.
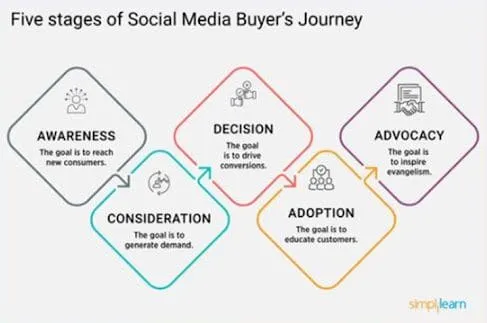
It helps to think in stages. Buyers move through a journey on social, from first becoming aware of you, through engaging and converting, to becoming repeat customers and advocates. Different metrics illuminate different stages, which is why no single number tells the whole story.
Which social media metrics should you track?
Group your metrics by what they’re trying to tell you. Here’s the full map, by funnel stage. The detail on each follows below.
| Stage | Metrics that matter |
|---|---|
| Awareness | Reach · Impressions · Follower growth rate · Brand mentions · Share of voice |
| Engagement | Likes, comments, shares · Engagement rate · Video engagement · CTA responses |
| Conversion | Click-through rate (CTR) · Bounce rate · Cost per click (CPC) · Conversion rate |
| ROI | Cost per acquisition (CPA) · Revenue generated · Social media traffic |
| Customer care | Response time · Response rate · CSAT · Retention rate · Conversation volume |
You don’t need all of these. You need the handful that map to your current goal, and the discipline to ignore the rest.
Awareness metrics: are people seeing you?
These are the metrics to watch if your goal is to grow brand awareness and get in front of new audiences.
- Reach: the number of unique people who saw your content.
- Impressions: the number of times your content was displayed, including repeat views by the same person.
- Follower growth rate: how fast you’re gaining followers over a set period, expressed as a rate rather than a raw count so you can compare like for like.
- Brand mentions: how often your brand is referenced by users, both tagged and untagged.
- Share of voice: your brand’s mentions measured against your competitors’, so you know how much of the conversation you own. Tools for tracking it are covered in our guide to social media monitoring.
A note on reach and impressions: they measure exposure, not impact. They tell you a post was seen, not that it landed. Treat them as the top of the funnel, not the bottom line.
Engagement metrics: is your content landing?
Engagement metrics tell you whether people are doing something with your content, not just scrolling past it.
- Likes, comments and shares: the basic signals of interaction. Comments and shares carry more weight than likes, because they cost the audience more to give.
- Engagement rate: the percentage of people who engaged relative to the number who saw the content. A small, highly engaged audience often beats a large, passive one.
- Video engagement: for video content, watch metrics like views, watch time and completion rate, which reveal whether people stay or drop off.
- CTA responses: how many people completed a call to action, such as a poll vote or a swipe-up. A direct read on intent.
Conversion metrics: is social driving action?
Conversion metrics measure whether your social activity turns attention into the outcomes you care about: registrations, downloads, sales.
- Click-through rate (CTR): how effectively your content drives people from social to your site.
- Bounce rate: the share of social visitors who land and leave without doing anything. A high bounce rate usually means a mismatch between the post and the page it points to.
- Cost per click (CPC): the cost of each click on a paid post or ad, a quick read on efficiency.
- Conversion rate: the percentage who took the action you wanted after clicking through. The metric most directly tied to commercial results, see how it plays out in our Russell & Bromley case study.
ROI metrics: what are you getting back?
ROI metrics answer the question every budget owner eventually asks: what did all this return?
- Cost per acquisition (CPA): what it costs to win a new customer or lead through social.
- Revenue generated: the revenue you can attribute to social activity, the cleanest line between effort and outcome.
- Social media traffic: how much traffic your channels send to your site, a measure of how well social feeds the rest of your funnel.
Marketer confidence in social ROI has climbed steadily over the past few years, and that shift tracks a simple capability: the ability to measure these numbers credibly and connect them to revenue. Brands that can prove the return keep the budget.
Customer care metrics: are you looking after people?
Social is a service channel as much as a marketing one. A happy customer is a returning one, so these metrics matter more than most brands give them credit for.
- Response time: how quickly you reply to questions and complaints.
- Response rate: the share of inbound messages you actually respond to.
- Customer satisfaction (CSAT): how satisfied people are with the service they get from you on social.
- Customer retention rate: how well your social activity keeps existing customers coming back.
- Conversation volume: the overall level of customer dialogue across your channels, a read on engagement and sentiment.
Which tools measure social media metrics?
No single tool does everything well; the right one depends on the metrics you care about. These are strong, widely used options:
- Google Analytics: free, and the standard for tracking referral traffic, conversions and on-site behaviour from social.
- Hootsuite Insights: real-time monitoring and reporting on activity, engagement and reach across platforms.
- Buffer: audience engagement, follower growth and post performance in one view.
- Sprout Social: management plus analytics, including social listening and benchmarking.
- Semrush: traffic, engagement and competitor analysis for the wider marketing picture.
Platform-native tools, Meta Business Suite, TikTok Analytics, YouTube Studio, give you the most accurate read on each channel and are the right starting point for platform-specific metrics. For influencer programmes specifically, creator-level performance lives outside most of these tools, which is part of the work we do at Vamp: building the measurement that connects creator content to commercial outcomes.
How to track social media metrics well
A few principles separate useful measurement from a wall of numbers:
- Define the goal first. Awareness, traffic, leads or sales: the goal dictates the metrics, not the other way round.
- Track a focused set. Pick the metrics that map to that goal and ignore the rest. More numbers rarely means more clarity.
- Watch trends, not snapshots. Metrics swing day to day. Set a regular reporting cadence and read the direction of travel, not the daily noise.
- Close the loop. Use what the data tells you to change what you post, where you post it, and what you back next. A metric that never changes a decision isn’t worth tracking.
How we see it
Most social reporting stops at exposure. Reach is the easiest number to pull, so it becomes the number that gets reported, and a brand ends up measuring how many people could have seen it rather than what any of it did.
Influence isn’t visibility. It’s the participation, conversion and repeat behaviour that visibility is supposed to produce, which is why measuring participation, not reach changes what a creator scorecard is for. The brands that grow on social are the ones that read past the impression count to the signals that actually predict it: who engaged, who converted, who came back.
Social media metrics FAQs
How do I choose the right tool for tracking specific metrics?
Start from the metrics you need, not the feature list. For cross-platform tracking, Google Analytics, Hootsuite or Sprout Social cover most needs. For platform-specific detail, use the native tools: TikTok Analytics, Meta Business Suite, YouTube Studio. Identify your priority KPIs first, then choose a tool that tracks them well and scales as you grow.
How often should I review my social media metrics?
It depends on the campaign. For always-on activity, review weekly or fortnightly to catch quick wins and underperformers. Time-sensitive launches may need daily checks. Use quarterly reviews for the deeper, strategic read: spotting longer trends and adjusting direction.
How do I benchmark my performance against competitors?
Combine internal analysis with external comparison. Tools like Rival IQ or Sprout Social’s benchmarking compare your metrics against competitors and industry averages, and reports from sources like HubSpot or Statista give sector-wide context. Benchmarks vary widely by industry, platform and audience, so compare against brands with a similar size and model for it to mean anything.
What’s the difference between reach and impressions?
Reach is the number of unique people who saw your content. Impressions count every time it was displayed, including repeat views by the same person. Impressions will always be equal to or higher than reach, and a high impressions-to-reach ratio means a smaller audience is seeing your content multiple times.
Metrics tell you what happened. A system decides what to do about it.
Knowing which metrics to track is table stakes. The harder, more valuable work is turning them into decisions: knowing which signals to act on, which creators and content to back, and how influence compounds across a brand over time.
That’s the work we do. Vamp is a tech-enabled influencer marketing agency: we design creator-led growth systems and build the measurement behind them, so attention becomes measurable growth instead of another report nobody reads. Talk to us.